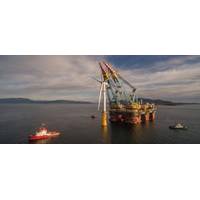
Back to School: Virtual Field Trip for 27,000 Students onboard Saipem 7000
farm, off the east coast of Scotland.The initiative was born with the aim of making children discover the exceptional work of Saipem engineers and technicians and to delve deeper into the themes of energy transition and wind energy. Participants were able to experience the trip through a special web application, during almost 10 hours of live streaming, with interactive methods such as questions, surveys and quizzes.The special visit is part of the series of virtual trips "CodyTrip" conceived and created by the spin-off of the University of Urbino DIGIT, in collaboration with the University
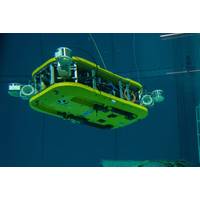
Tech File: Dual-Arm AUV Emerges from German Consortium
at. Furthermore, tt is also possible to define own voice terms during the mission and to use them as alias, e.g., for camera or docking positions. In order to complement the innovative interaction technologies, the DFKI Embedded Intelligence research department in Mare-IT has developed a web application that allows the AUV to be controlled and change parameter settings via mobile devices such as smartphones or tablets. In addition, the researchers investigated the possible use of artificial, oscillating magnetic fields for localizing the underwater robot.Robust Thruster Drives with Intelligent
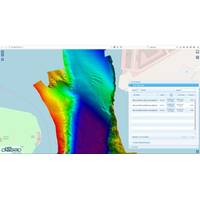
Real-time Mapping, Visualization in CARIS Onboard 2.0
, the redesigned control centre dynamically controls and monitors the automated system. Products generated including surfaces, backscatter mosaics, and the survey track lines are live-streamed during acquisition and accessed through a web browser. By providing access to processed products in a web application, the new Control Centre allows review of a survey dataset from any device with a network connection to the vessel. This increased access allows information about survey operations to be accessible when and where needed. Other updates in this version include a simplified installation
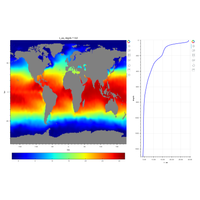
Open-source Software for Environmental Science Community
oceanographic data variability in order to better understand military sonar performance in complex underwater environments. RTS has engaged with the Defense Science and Technology Laboratory (Dstl) and Royal Navy staff to present the software capabilities and discuss uses. The web application software architecture separates data access and manipulation from data visualization, allowing devices running only a web browser to rapidly interact with data handled on a server or desktop PC over a network. Benefits of this approach include the potential for powerful data visualization
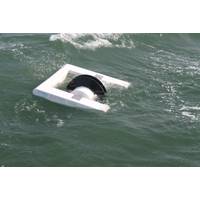
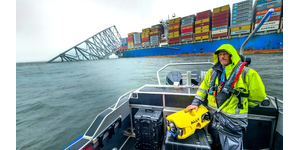
Buoy Harnesses Wave Energy to Power Instruments at Sea
is logged from the buoy through a fiber optic Ethernet connection in the mooring line, and the data is transmitted from the buoy to shore per satellite, 3G or 4G connections. Therefore, with the Resen Waves buoy it is now possible to access instruments in real time through smart phones or a web application, no matter where the instruments are located in the big oceans without some of the usual power limitations. The buoys require an average wave height between and 0.5m and 2m and can be installed in water depths from 10m and up to 200m as standard. Special versions are available can be
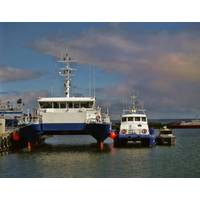
Case Study: Surveying Wrecks around Estonia
work in the Hydrographic Department. The survey season is usually from May until November, while the data processing is mostly done during the winter. All of the collected and processed data enters the hydrography information database - HIS. Data layers from this database are then available in the web application Nutimeri (Smart Sea). To this day, the Hydrographic Department has charted some 47 percent of Estonia’s maritime areas and the long-term objective is to chart 100 percent, which is stated in the maritime policy of the state. The survey fleet The Estonian Maritime
EPA Releases EnviroAtlas Ecosystem Mapping Tool
relationships between nature, health and well-being, and the economy. EnviroAtlas combines hundreds of data layers developed through collaboration between EPA; U.S. Geological Survey; U.S. Forest Service; other federal, state and nonprofit organizations; and several universities. Using powerful web application tools, it lets users generate customized maps and images that show the condition of their local community’s air, water, and landscape; as well as population density and other demographic data. Users can investigate land cover patterns, see how ecosystem services reduce pollution, and view