Digital Transformation of Port Operations
By Guy T. Noll
Electronic Navigational Chart (ENC) data, also known as S-57 data, provides a great beginning for a national marine spatial data infrastructure (MSDI). Unfortunately, in much of the world outside the United States, national hydrographic office licensing restrictions on ENC data—implemented to ensure quality of navigation information for safety of life at sea (SOLAS) compliance—limit the official use of S-57 data for non-navigational purposes. In an analogous limitation, many ports—where the economic levers of maritime advantage for a region or nation are fulfilled—do not perform the requisite data management that leads to the explicit assessment of risks to their underwater infrastructure. However, the National Oceanic and Atmospheric Administration (NOAA) has been exceptional in its open data policy for S-57, and this has led to broad innovation in the use of ENC data in both navigation applications and non-navigational engineering and biological analysis.
Every port has depth information. After all, that’s what differentiates a port from the non-port land around it; personnel know how deep a ship’s draft can be for cargo transfer. This information needs to get to the mariner and be sent upstream, respectively, to the cargo shipper; to the cargo contract holder; to the insurance agency; and, finally, to the reinsurer. Currently, the primary mode of delivery of that information to all parties is the ENC for commercial shipping. National hydrographic offices, such as NOAA’s Office of Coast Survey, compile these information products and disseminate them by a variety of means. This ensures that the information meets certain requirements and can be legally substantiated. A significant amount of expertise and manpower is required to conflate and compile the data into these cartographic products, and making them has traditionally been a multimonth or, sometimes, multiyear effort. This degrades the value, however, because by the time the end product ENC is in use by the supply chain, the actual depth along the transit can change from what was reported to the mariner, the shipper and the insurer.
NOAA has moved to a vector-first production cycle to improve the velocity of the information product supply chain, and feedback on the NOAA National Charting Plan raised eyebrows when the option of eliminating printed charts was brought up. There are now weekly releases of ENC updates, and NOAA is investigating a user-driven area-of-interest printing system that uses the same information stream. Usability could be improved by increasing the velocity of data from the ports. But what if a port could provide responsible data that has reliable metadata for inclusion in NOAA’s compilation system? Taking this a step further, what if there were a local copy of the compilation system that the port could maintain and periodically check in to the NOAA system? Extending this pattern to computing clouds, an authoritative and role-based access subscription in a Federal Risk and Authorization Management Program (FedRAMP)-certified system would allow ports to easily participate in a national system that provides the best access to the most recent navigation information.
These assessments should be made using maintenance procedures that include the following: surveys performed prior to and after dredging to determine payment and identification of dredging periodicity requirements, accurate surveys of berthing areas for loading at lower stages of tide and determination of the threshold clearance depth in a common area for access to a port from the main entrance. If only performed as baselines or snapshots—and not surveyed with ample coverage or enough frequency to enable staff to understand change over time—port operations assume a time-varying risk relative to a variety of factors, including water levels, sedimentation rates, sea states and vessel draft.
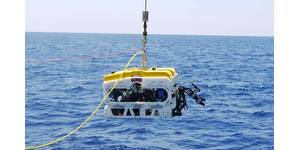
Reducing navigational risk by taking a more active role in underkeel clearance management is a goal of a prototype project undertaken by the Port of Los Angeles and NOAA’s Office of Coast Survey. In this project, live measurements of the ocean swell at the port’s entrance, combined with high-resolution bathymetric surveys, have helped define allowable ship drafts for the port and the pilots at sea and provided decision support guidance to reduce risk of grounding. Taking this prototype project to a national scale would require more instrumentation and a framework of activities that would overwhelm smaller ports’ limited staff. However, there may be a way to leverage what has been learned in the Port of Los Angeles and apply that knowledge through a computing cloud-based data pattern, resulting in getting navigational information to the mariner in a more timely manner. For many U.S. ports, this information could be added to the NOAA Physical Oceanographic Real-Time System (PORTS) observation network.
Such a system would give the port control over how often and to what extent the information reaching the supply chain would be updated. This then would afford a competitive advantage to the port’s operational infrastructure. Simultaneously, it would increase the value of the MSDI that NOAA contributes to the national Blue Economy along with the river infrastructure maintained by the U.S. Army Corps of Engineers, the highway infrastructure maintained by state departments of transportation and the aviation infrastructure maintained by the Federal Aviation Administration and airports.
A centralized geographic information system (GIS) can share compiled ENC information while maintaining the security of underlying data, thus ensuring that vector information can be used for nonnavigational purposes and not in chart compilation. GIS allows the authoritative output of the hydrographic office to be shared with key stakeholders, whether those are national agencies responsible for safe navigation, regional authorities in charge of marine spatial planning or ports managing underkeel clearance risk. The Information for Maritime Infrastructure (IMI) of ports, including the myriad silos of vessels’ real-time information, meteorological conditions, water levels and shoreside assets, should all be brought together into a unified common operating picture (COP) for situational awareness. Also, this COP should be viewable by any authorized users—from anywhere, at any time, on any device—according to their role in the operational shipping activity. A flexible software platform with open data architecture and a holistic GIS can provide such a picture.
A port may have a few surveys from past dredging projects—maybe from pier reconstructions—in formats such as comma-separated variable (CSV) text, spreadsheets, ASCII XYZ, AutoCAD or Terramodel format. As foundational datasets, these surveys need some descriptive text—such as the date of data acquisition, who did the surveying and what kinds of instrument and positioning were used—to become informative and retain value over time. Of course, vertical and horizontal reference points for the data are needed, too. If these points are all converted to a point cloud of XYZ and a grid is created from that cloud, when this data is combined with the attributed metadata, the result is a bathymetric surface that has attributes at each grid.
The Author
Guy T. Noll is Maritime Principal Consultant, Esri