Golden Software updates Surfer Mapping Tech
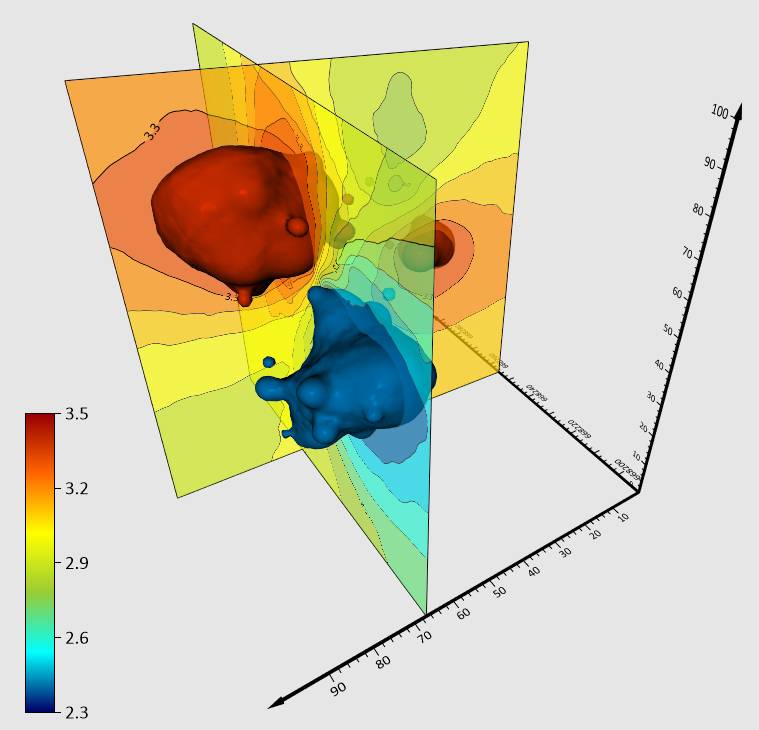
With updates to Golden Software's Surfer technology, users can create any number of contour slices, at any orientation, through their 3D grid. Credit: Golden Software
Golden Software added the ability to download georeferenced Google aerial and satellite images to map projects in the latest version of its Surfer mapping and 3D visualization package. Other new features focus on faster and simpler creation of 3D visualizations that are easier to interpret and understand.
Surfer enables users to model data sets, apply an array of advanced analytics tools, and visually communicate the results in a way that even the non-technical stakeholders can understand. Surfer is used by more than 100,000 people worldwide, many involved in environmental consulting, water resources, engineering, mining, oil & gas exploration, and geospatial projects.
The following upgrades have been made in the latest release of Surfer and are now available:
- Direct Google Maps Access
- Colorized 3D Drillhole Intervals Based on Keywords
- Contour Slices in 3D View
- Linked Text
“The ability to easily download reliably high-quality basemap images from Google Maps adds a rich layer of information that puts a mapping project in its proper geographic context,” said Surfer Project Manager, Kari Dickenson. “Surfer users will find they can communicate their work more accurately and vividly with the latest software version.”
As is tradition, Golden Software has also released a Beta version of Surfer simultaneously with the new version to give customers a chance to try out new features and provide feedback while they are still in development. Users may find the Beta version by clicking "File | Online | Try Beta Version" from within Surfer.
The new Beta features in Surfer fall under two categories: 3D Viewing and Legends.
3D viewing includes:
- Create, Edit and Export Contact Points in Drillholes
- Multiple Light Sources
Legends features:
- Create names for unique value attributes
- Display only the properties that are applied in the layer
- Change the size of the line sample in the legend
- Change the size of the symbol sample in the legend
- Set alignment of samples as left, center, or right
- Put the line style around a polygon fill sample
- Separate attribute samples, such as polylines and polygons, into different rows.
“In the Beta features now under development, we continue to make the 3D visualization capabilities more robust and easier to use in Surfer with the goal of saving time and reducing headaches,” said Dickenson.