New Maps of Seafloor off San Francisco
(Image: Hydro International)
Three new sets of maps detail the offshore bathymetry, habitats, geology and submarine environment of the seafloor off the coast of San Francisco, Drakes Bay and Tomales Point, U.S.A. Critical for resource managers, the maps are part of the California Seafloor and Coastal Mapping Program, a series of maps published by the U.S. Geological Survey with support from the California Ocean Protection Council, NOAA and 15 other state and federal partners.
The maps are designed to be used by a large stakeholder community and the public to manage and understand California’s vast and valuable marine resources.
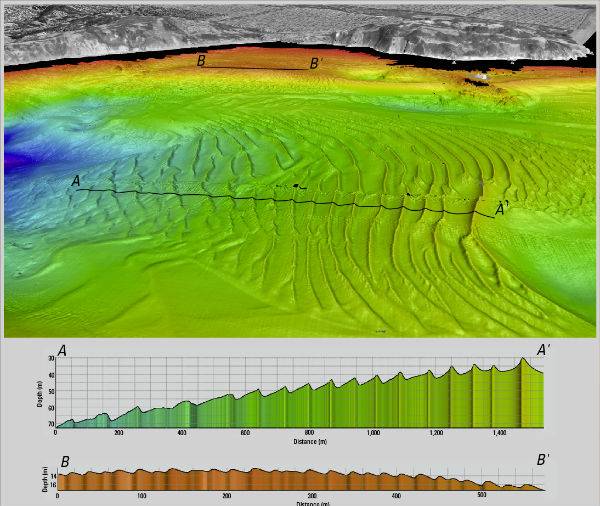
The new ‘Offshore of San Francisco’ maps document the complex submarine environments along the inlet to San Francisco Bay formed by strong tidal currents, including spectacular sand waves (image), a deep scour pool beneath the Golden Gate, and the dynamic offshore San Francisco mouth bar and 'Potato Patch' shoal. Sediment distribution maps reveal only a thin sediment cover offshore of the Ocean Beach (San Francisco) erosional hotspot (a pattern extending south to San Gregorio), indicating that today's present coastal erosion will be a continuing problem, likely to be exacerbated by continuing sea-level rise.
Geologic maps incorporating subsurface data document the location and geometry of the San Andreas, San Gregorio and Point Reyes fault systems, and show how their interactions led to uplift of Point Reyes and development of a deep sediment-filled basin. The ‘Drakes Bay and Vicinity’, and ‘Offshore of Tomales Point’ maps reveal the diverse and complex range of seafloor habitats typical of the California coast, ranging from the rugged granitic bedrock along the high-energy west coast of Point Reyes to smooth sand and mud in the more protected Drakes Bay environment that includes the Point Reyes State Marine Reserve.
NOAA is a partner in this integrated ocean and coastal mapping project. By working with partners from across federal, state, academic and private sectors, they are able to combine data resources and maximize the efficiency in applying a ‘map once, use many times’ approach that benefits all, according to Rear Admiral Gerd F. Glang, director of NOAA’s office of coast survey.
The program was initiated seven years ago with the goal of comprehensively surveying and mapping all of California's state waters. The vision was ambitious – comparable mapping on this scale has not been attempted anywhere else in the world. Each of the three publications includes 10 map sheets, a pamphlet and a digital data catalogue. The maps and mapping data have a large range of applications. They provide:
- A foundation for assessing marine protected areas and habitats.
- Baselines for monitoring coastal change and sea-level-rise impacts.
- Critical input data for modeling and mitigation of coastal flooding.
- A framework for understanding coastal erosion and developing regional sediment management plans.
- Contributions to earthquake and tsunami hazard assessments.
- More accurate maps for safer navigation.
- Essential information for planning, siting, or removing offshore infrastructure.
Sam Johnson, the USGS project lead, also notes that there is a ‘WOW!’ factor to the new high-resolution datasets and maps. They're allowing scientists to pose new questions and are having a significant role in stimulating research. There is also evidence of a positive impact on public education and awareness.
To date, 12 map sets and catalogues have been published. Ten additional map sets are now being formatted for publication, which will complete coverage in the Santa Barbara Channel (Oxnard to Gaviota) and from Marina northward to beyond the Russian River. The maps are created through the collection, integration, interpretation, and visualization of swath sonar data, acoustic backscatter, seafloor video, seafloor photography, high-resolution seismic-reflection profiles and bottom-sediment sampling data.
The California Seafloor and Coastal Mapping Program is a collaborative effort supported by the USGS, the California Ocean Protection Council, NOAA, California State University at Monterey Bay, Moss Landing Marine Laboratories and many other academic, government and industry partners.
Image: Perspective view looking to the southeast over entrance to San Francisco Bay. Golden Gate Bridge is to left (east) of this view. The large sand-wave field lies within Golden Gate channel, and formed from sediment transported out of the Bay by strong tidal currents. Profile A–A’ shows that the larger bedforms can reach heights of over 7m and are asymmetrical with steeper sides towards the open coast. A smaller field of sand waves to south near Baker Beach shows the opposite symmetry (steep sides toward the Bay) indicating that the strongest tidal currents in that local area are directed eastward.