Monitoring the Restless Earth for the Next “Big One”
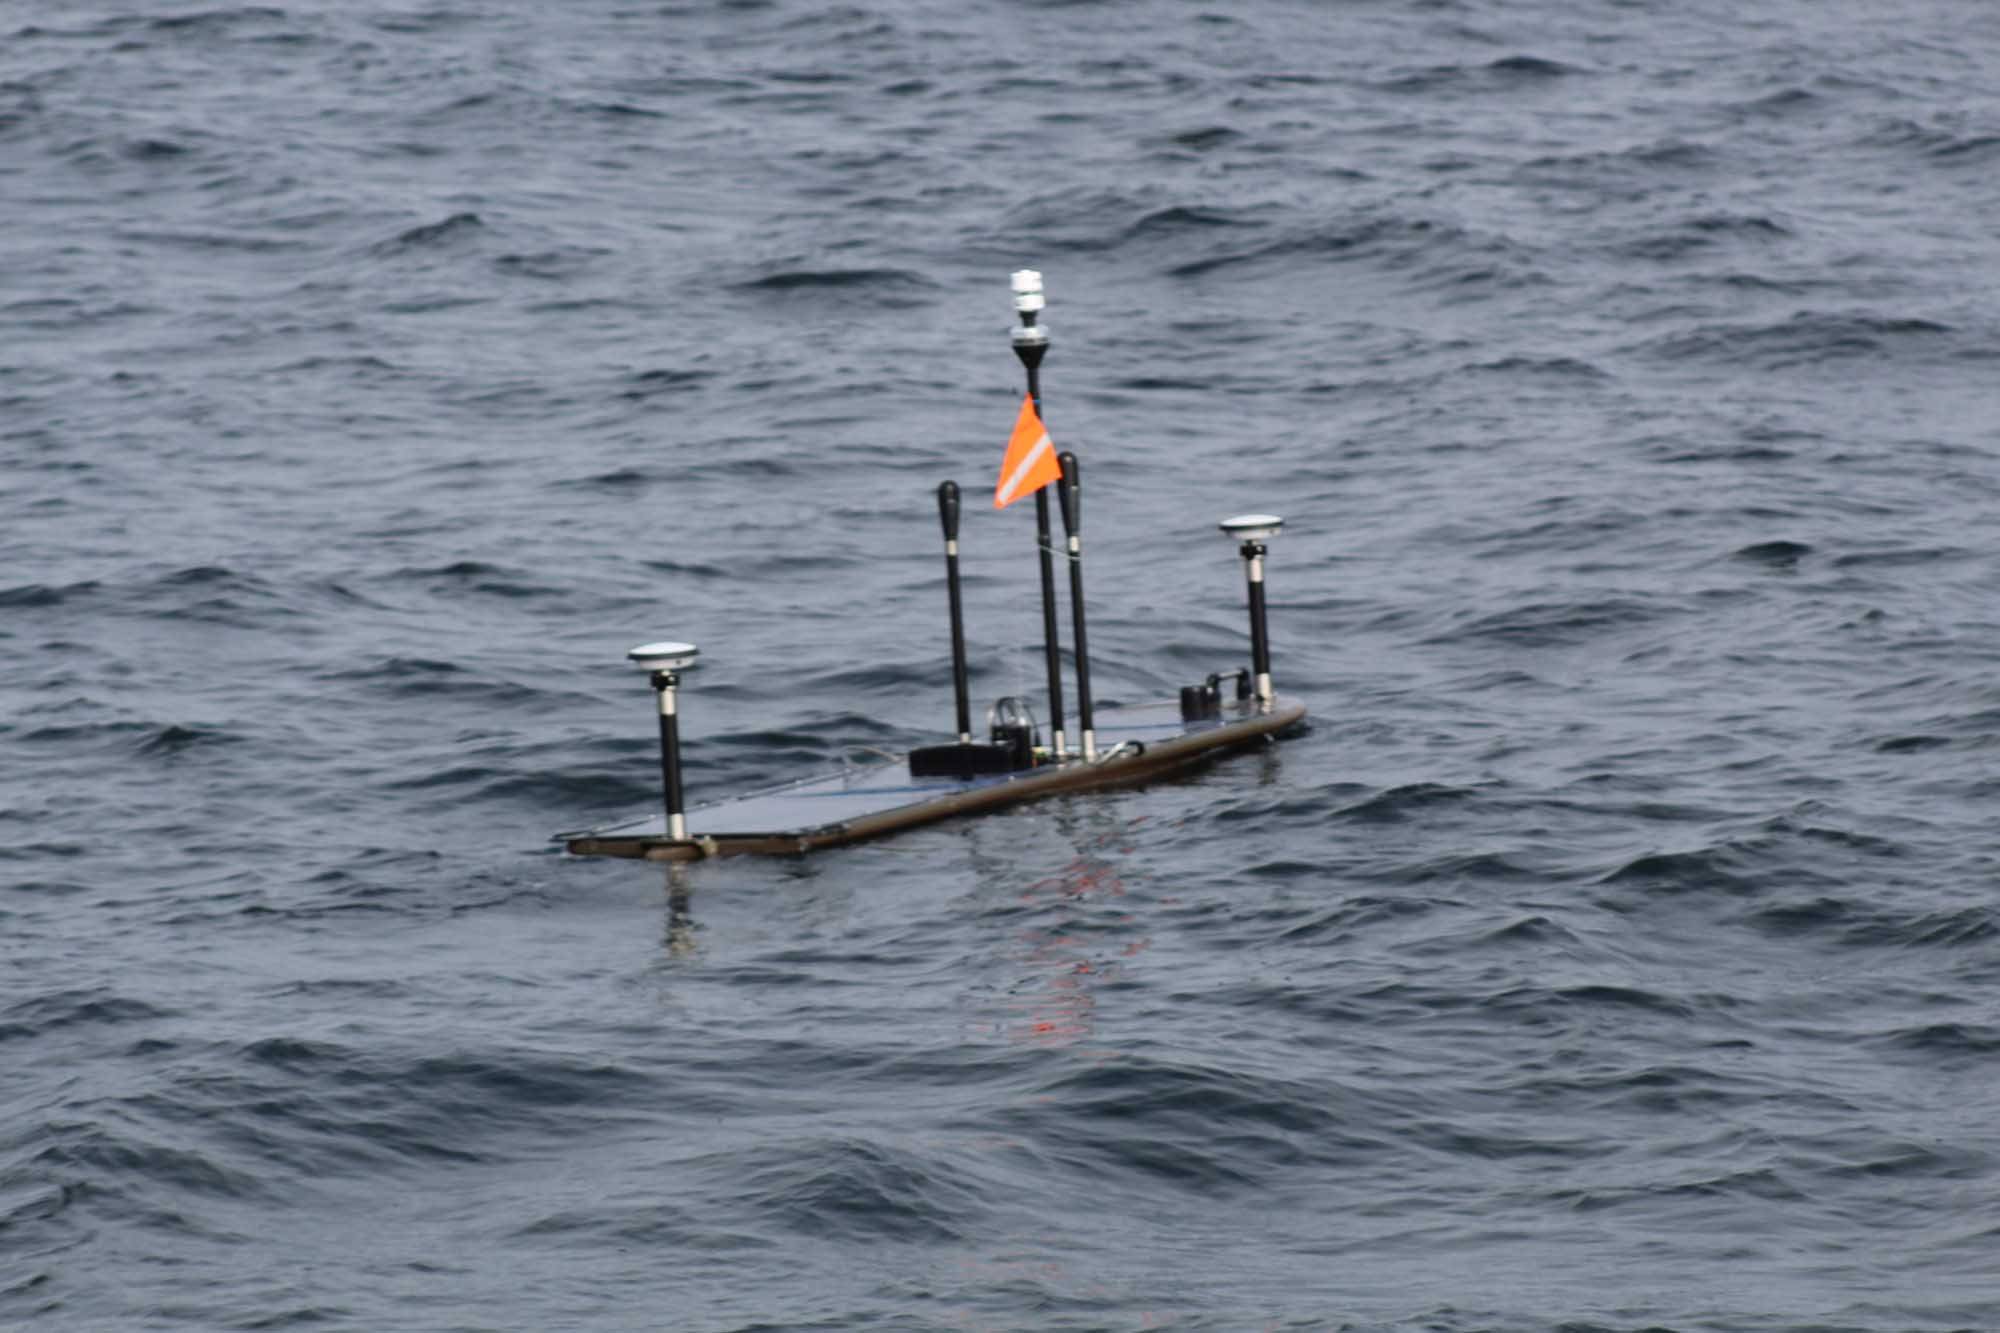
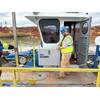
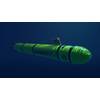
The USGS Wave Glider on mission equipped with Sonardyne GNSS-A instrumentation. Credit: USGS
When the 8.2 magnitude Chignik earthquake hit off the coast of Alaska in 2021, it was a big warning signal.
The largest earthquake in the US since 1965 and one of the largest globally in recent years; it was a reminder of the geohazards lurking, out of sight, off our coastlines.
Offshore events like these could trigger a tsunami, putting major coastal cities and regions at risk.
But, until recently, the geological activity that leads to an earthquake like Chignik was a significant blind spot to scientists, lying hidden and inaccessible beneath the waves.
Now, thanks to ongoing collaboration and development between underwater technology company Sonardyne, Scripps Institution of Oceanography and the U.S. Geological Survey (USGS), the ability to remotely monitor our restless earth is not just possible but also becoming standard practice.
Using a technique called GNSS-A, an increasing amount of coastline most vulnerable to earthquake and tsunami hazards, including the US Pacific Coast, is being monitored.
What is GNSS-A?
GNSS-A works by combining satellite positioning with underwater acoustics to track seafloor movement with centimeter-level accuracy. An uncrewed surface vessel (USV) with Sonardyne’s GNSS-A payload patrols above an array of Sonardyne Fetch transponders on the seabed.
Combining its known surface position with acoustic pulses down to each Fetch transponder allows it to calculate the precise position of each transponder – and therefore the position of the seabed it’s sitting on.
By repeating these measurements over time, scientists can track the movement of tectonic plates across faults to better understand and estimate earthquake and tsunami hazard.
One of the organizations using this technique to monitor subduction zones, where one plate is sliding under another, is the USGS.
They first started exploring its use in 2017, working in collaboration with the University of Hawaii and Scripps, and using a Wave Glider and seabed sensors, in order to measure how friction between two tectonic plates restricts sliding and causes a build-up of stress - essentially measuring “how stuck are the plates.”
Since then, they’ve continued to contribute to the development of GNSS-A using Sonardyne GNSS-A modules and Fetch transponders.
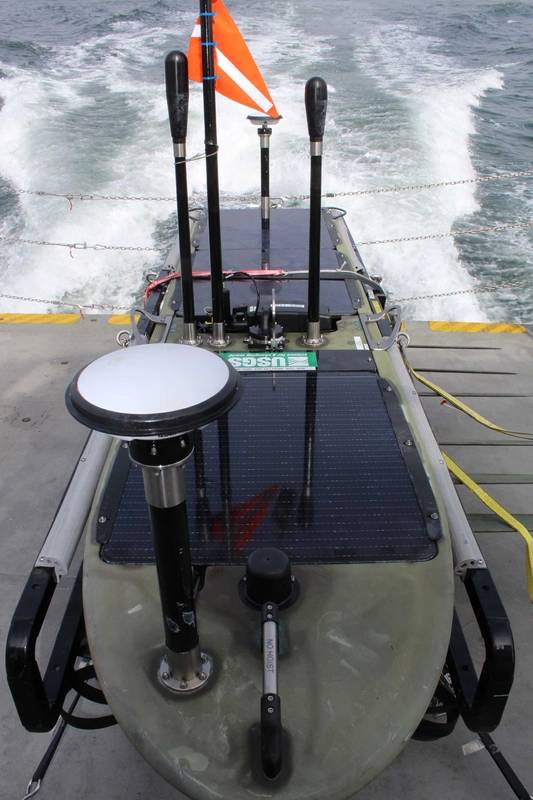
 Preparing the USGS Wave Glider for launch aboard California Polytechnic State University Humbolt's R/V North Wind. Credit: USGS
Expanding GNSS-A monitoring along the Cascadia Subduction Zone
A big focus for USGS is the Cascadia Subduction Zone, a 1,000 km long fault off the Pacific Northwest coast that runs from Vancouver Island in Canada to northern California.
Between 2021 and 2025, USGS has installed four monitoring sites on the seabed off the US Pacific coast at the southernmost extent of this zone.
They are part of a wider network along the Cascadia Subduction Zone where subduction involves three plates, the Explorer, Juan de Fuca and the Gorda, sliding beneath the North American Plate, creating the potential for magnitude 9+ earthquakes and large tsunamis.
The USGS GNSS-A sites, each with three Fetch transponders, are on the southernmost Gorda plate where the uncertainty of the Gorda plate motion relative to the North American plate motion has implications on the size and recurrence of earthquakes in the region.
“Before we had this capability, we were only able to use GPS networks on land to estimate, to a sub-millimeter level, the slow movements of the seafloor 50 plus miles offshore,” says Todd Ericksen, Geodetic Engineer at the USGS’ Earthquake Science Center in California.
“But the seafloor was a blind spot; a major missing piece of the global tectonic jigsaw puzzle which meant the true scale of the hazard beneath the ocean was largely unknown. Our instruments stopped at the shoreline.”
“For somewhere like the Cascadia subduction zone, where oceanic plates are being subducted beneath the North American plate, seafloor geodetic sites are filling a major gap, helping us to better understand earthquake and tsunami hazard. If plates ‘lock’ in this zone, building up stress, that whole coastline, and cities like Vancouver, Victoria and Seattle, face significant tsunami risk.”
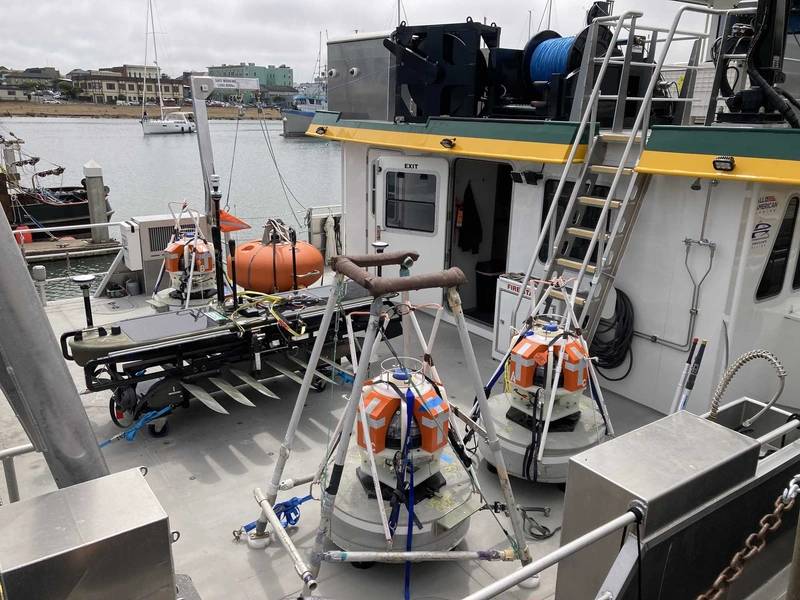 GNSS-A equipped Wave Glider midships, loaded aboard the R/V North Wind in Eureka, CA, and surrounded by three seafloor geodetic benchmarks to be deployed along the Cascadia Subduction Zone. Credit: USGS
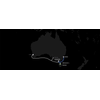
 Topo-bathymetry map of the Cascadia subduction zone showing geodetic velocities on land and offshore USGS and NSF seafloor geodetic sites. Credit: USGS
Critical insights from the Aleutian subduction zone
One of the tectonic sources of large earthquakes that USGS has been monitoring is the Aleutian Subduction Zone. It was here that the Chignik earthquake struck – and USGS was ready for a post-earthquake response mission.
Just a couple of years before, three GNSS-A monitoring sites had been set up on the seafloor off Alaska, in the Aleutian subduction zone, by a team of scientists funded by US National Science Foundation (NSF).
Several Wave Glider surveys had been carried by the USGS and Scripps prior to the M8.2 Chignik earthquake, monitoring the position of the sites in about 1,200 m water depth.
Within weeks of the earthquake, USGS had their Wave Glider back out to measure what movement there had been during and shortly after the earthquake.
Despite challenging weather conditions, the mission collected high-fidelity GNSS and acoustic data with eye-opening results.
“The tsunami was modest, but the seismic event was the largest in the US for nearly six decades,” says Ericksen, “so we expected a large movement. But it was incredible to know exactly how much – and that was 1.4 m.” This was a critical insight into the co- and post-seismic movement, helping to understand subduction zone dynamics.”
The big question was, did the Chignik earthquake increase the state of stress and tsunami potential on the up-dip portion of the fault or not?
“The measurements showed that the fault moved 2 – 3 m horizontally in a shallow part of the fault, less than 20 km below the seabed, helping us to understand how stress builds up along the fault and is released in an earthquake,” he says
“These results suggested that the cumulative slip had relieved stress on the shallow portion of the fault and therefore, the Chignik earthquake likely did not increase tsunami potential of the shallow fault.
“It also showed the effectiveness of the GNSS-A technique and the utility of rapid response GNSS-A measurements to better assess tsunami and earthquake hazards in the region.”
The origins of GNSS-A
The ability to measure the movement of plates on the seabed is not that new. It’s based on what was originally called the GNSS-A technique, first developed by Scripps, specifically David Chadwell and Fred Spiess.
“Combining GNSS positioning and acoustic measurements to track seabed movement was a clever idea – and it worked,” says Michelle Barnett, Ocean Science Business Development Manager, at Sonardyne.
“But the cost of using crewed ships to do the positioning made it cost prohibitive. It was also technically challenging.”
“So, working with Scripps, in the early
2010s, we developed a combination of our Fetch long-life sensors and an off-the-shelf GNSS-A payload for Wave Gliders that can go out and do the survey work at a much lower cost than using a crewed ship.”
 The USGS Wave Glider recovered aboard the R/V North Wind after a successful survey. Credit: USGS
Worth the wait, even when waiting on weather
The technique is not without its challenges, however. After gathering the positions of the Aleutian subduction zone transponders, Ericksen and his team were naturally keen to see the data.
Due to the significant amounts of data involved – we’re talking 25-30 GB per site (comprising three Fetch) – only sub-samples are sent back to shore from the USV, primarily for quality control.
So, they have to wait until the USV comes back – or is brought back – to shore. Low levels of daylight in the Alaskan winter (when the Chignik survey was carried out) meant limited power availability for the USV.
Combined with bad weather, coordinating its recovery proved challenging, resulting in it taking four-months to recover the Wave Glider and offload the data.
Still, the wait was worthwhile and the results are providing greater insights than we’ve ever had before.
Read more on the Chignik data in ScienceAdvances Vol.9, No.17, Rapid shallow megathrust afterslip from the 2021 M8.2 Chignik Alaska earthquake revealed after seafloor geodesy.