Stepping on the Gas: Rochester Researchers Team to tackle Methane Emissions
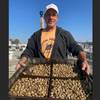
Dr. John Kessler (right) and Dr. DongJoo Joung (Pusan National University) collecting methane for radiocarbon analysis. All images: University of Rochester/John Kessler
With global temperatures rising, oceans warming and ice caps melting, carbon dioxide attracts the bulk of the blame throughout media, public discourse and academia. All too many—save some scientists and researchers—neglect methane, the second biggest greenhouse gas that’s influenced by human activity. Often associated with livestock production and ruminant flatulence, methane has both natural and anthropogenic sources and is garnering more attention as science strives to understand the holistic effects of the warming planet.
Researchers at the University of Rochester have embarked on a mission above and below the blue waves to better understand natural sources of methane and how a changing climate may impact these stores. Professors John Kessler and Thomas Weber of the Department of Earth and Environmental Sciences set sail on a research cruise this past summer onboard the R/V Hugh R. Sharp, continuing a project that first took to the seas in 2019, only to be delayed by the pandemic. While the two scientists led different roles on board and in the lab (Kessler gathering large field data sets and Weber developing machine learning models), both had done previous work with methane emissions, inspiring the current collaboration.
Seas-ing an opportunity
Methane poses a threat to the environment as it traps heat in the atmosphere, contributing to global warming. Sources that are unexposed to the atmosphere are less of a concern unless they become destabilized. Methane hydrates, which form on the seafloor when significant amounts of gas meet high pressure and low temperatures, are a solid that typically remain stable, although past research sought to determine if they contributed to climate change as oceans warm. “We’ve more or less debunked that, which is great,” said Kessler. “But in doing so, we realized that the closer you got to land, in the coastal oceans, methane concentrations went super high.” The uncertainty of the data in these areas was also high due to relatively few sampling points, pointed out Weber, who realized machine learning modules could help generate informative maps. Thus, the marriage of measurement science and artificial intelligence (AI) was born.
A unique aspect of this summer’s research cruise was that it built on a previous expedition conducted in 2019 onboard the R/V Rachel Carson, leveraging knowledge of what worked well and what didn’t. The pandemic provided the team with two years of being landlocked in Rochester, N.Y., during which they tweaked equipment and sought ways to continue their work on the nearby Great Lakes. The greatest inhibitor though was the size of the equipment, which was too big to place on anything smaller than a research vessel. The solution? “We looked to miniaturize it,” Kessler stated. “Let’s look at every component that we have, and can we do this in a way that’s smaller, cheaper, easier—where we can literally get it on a kayak? And the answer to that is yes.” In addition to lightening the equipment and decreasing its size for convenience, the team made the instruments more reliable in continuously collecting data with less researcher oversight.
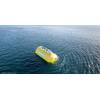
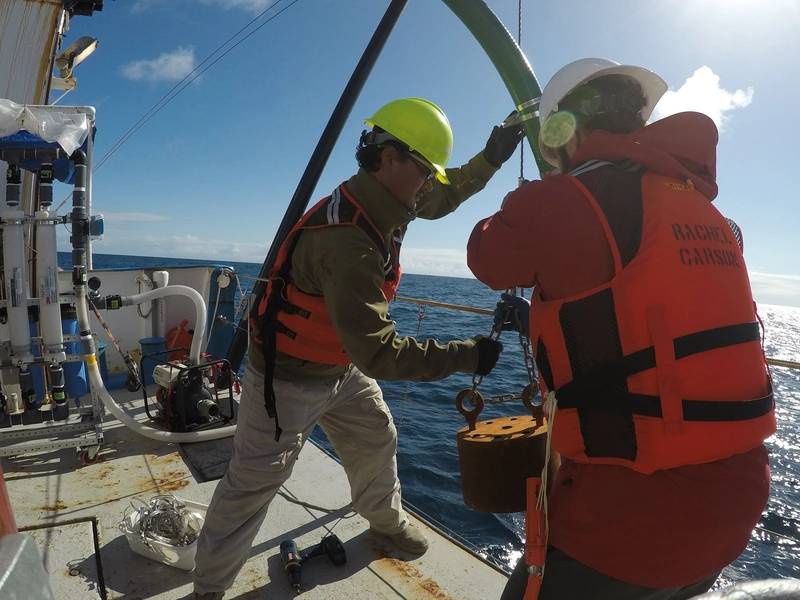 Dr. DongJoo Joung and Dr. Mihai Leonte (University of Rochester) deploying equipment for methane sampling. All images: University of Rochester/John Kessler
A hull of a research cruise
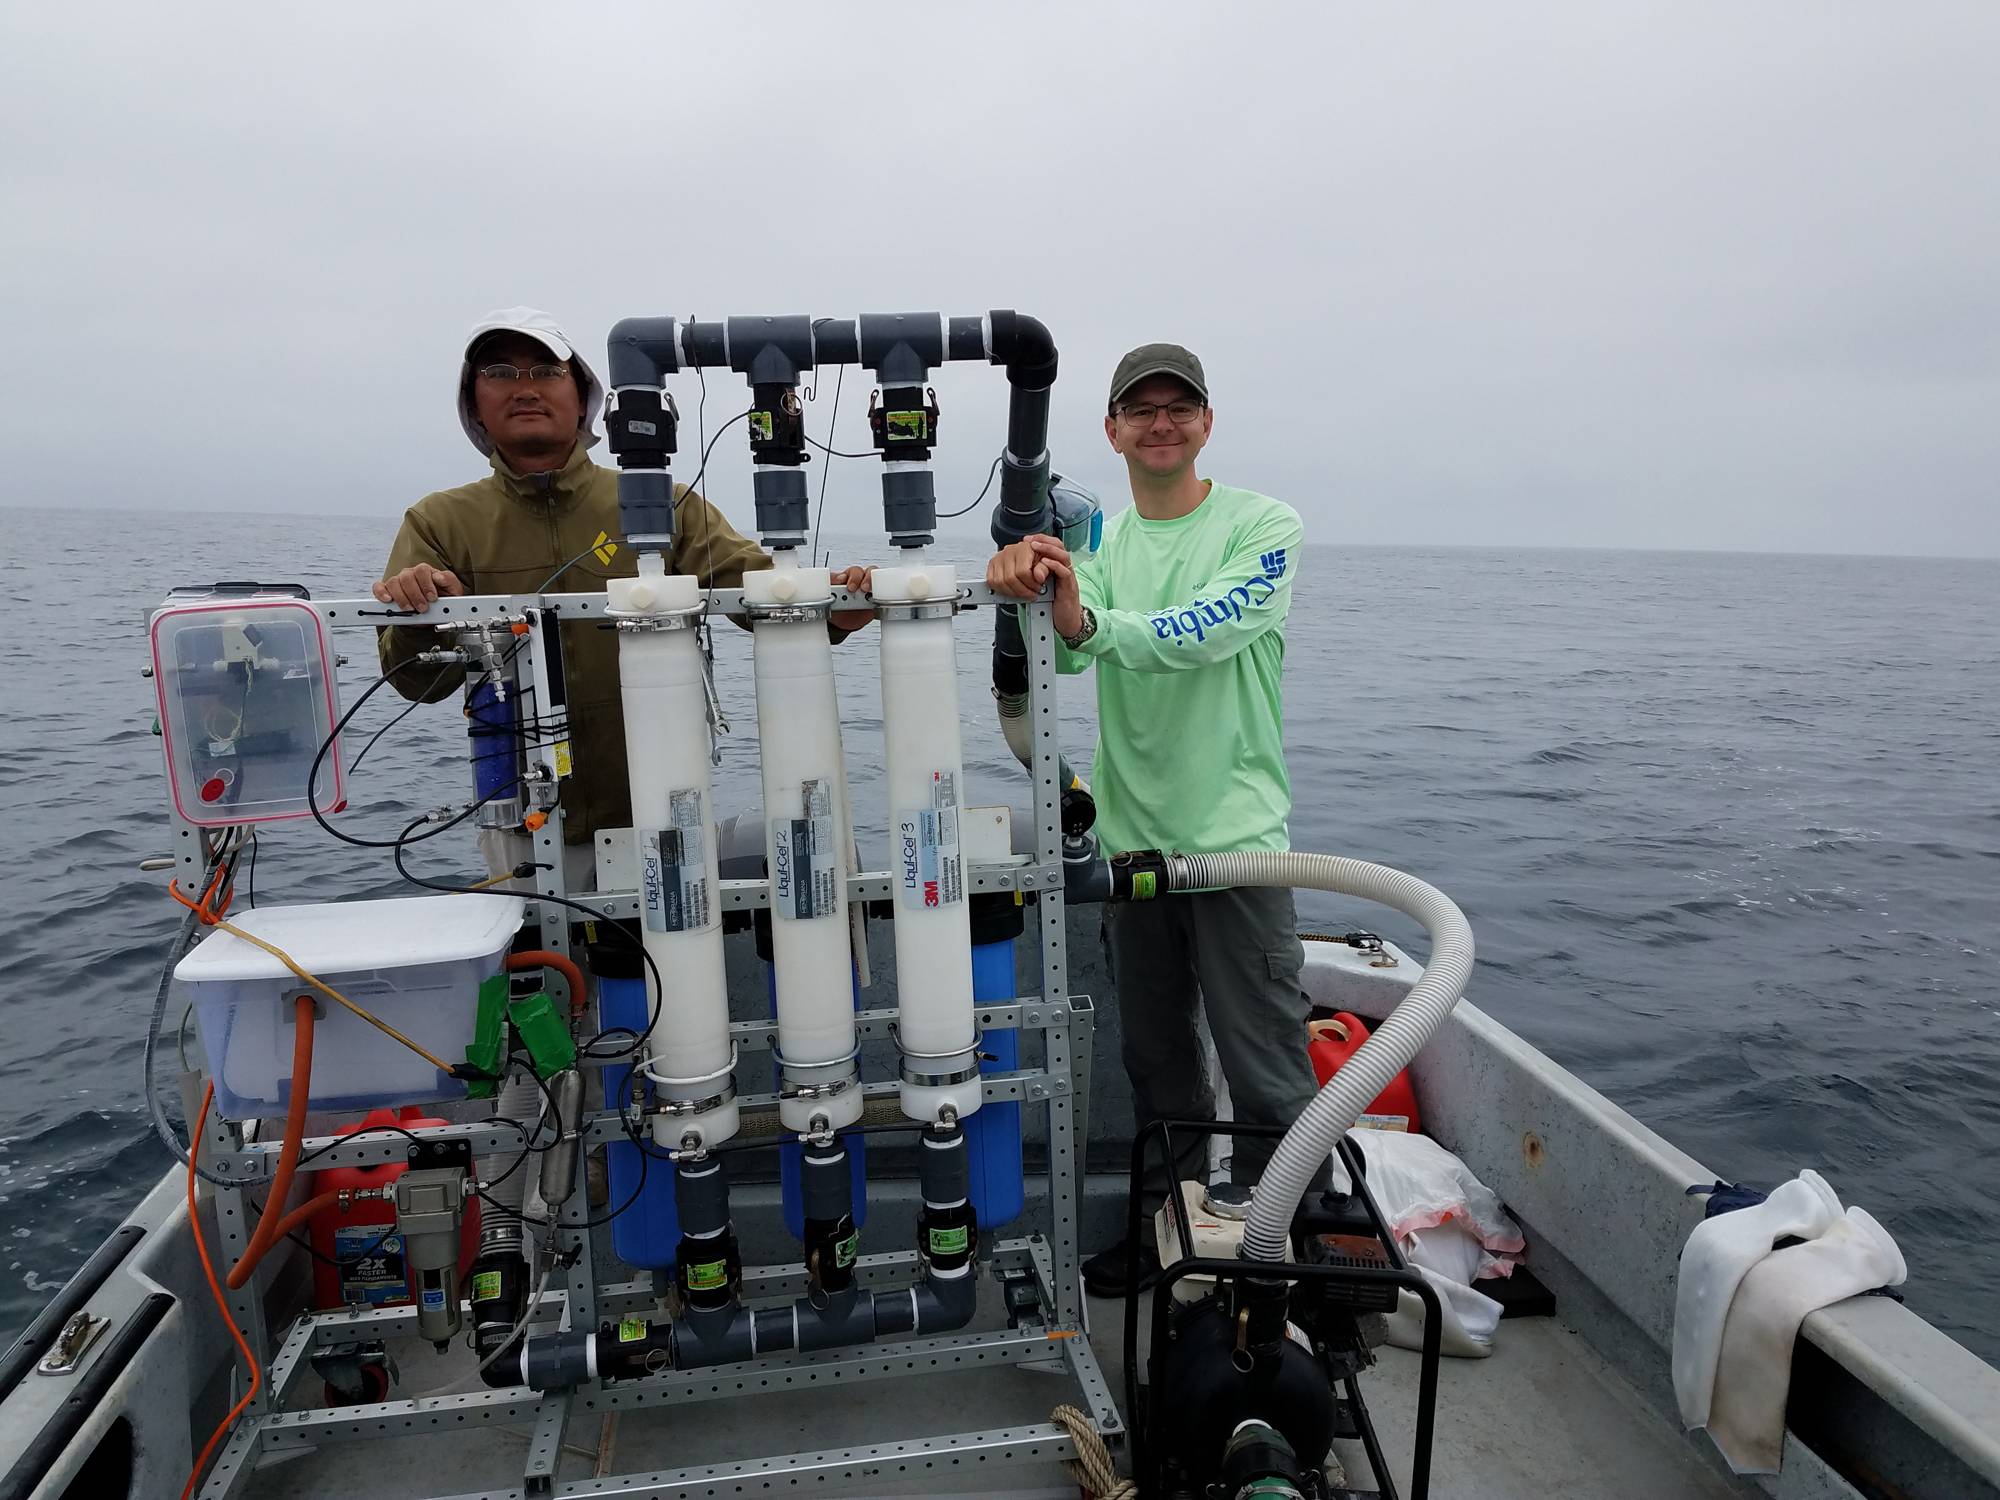
The cruise spent 26 days on the water, leaving Delaware to travel down the east coast of the United States, around Florida, into the Gulf of Mexico and back. The boat “ping ponged” along the coast, getting as close to the shore as possible and then sailing out across the shelf, all while continuously collecting data from a series of instruments. While the measurements were taken autonomously, the crew had many tasks at hand, like monitoring the equipment. A pump was mounted off the side of the ship that continually diverted water through spectrometers to measure gases and then other instruments to measure variables like temperature, nitrate, chlorophyll, salinity, pH, and turbidity.
Two additional experiments, conducted by the researchers directly, took place alongside the autonomous data collection. “We keep talking about methane sources and methane emissions. There are microbes in the water that eat methane…we’re very interested in that process. Not only are we interested in the sources, but the sinks,” commented Kessler. Monitoring the microbes involves incubation, so the team took water samples to the lab and measured how methane was consumed as a function of time. They also radiocarbon dated methane in the coastal oceans as they sailed. The process, far from autonomous, involved collecting between 1,000 and 40,000 liters of ocean water, which Kessler described as ridiculous. “We’ve developed a way where we deploy a 3-inch diameter hose down to anywhere from the surface to 500 meters; we pump water up at about 200 liters a minute. As it’s flowing up, we suck off all the dissolved gases, which we compress into a metal oxygen tank and bring home.” The team is looking specifically at tracing methane bubbling up from the seafloor from hydrate forms decomposing in warmer waters, he added. Radiocarbon dating allows them to see how far up the water column methane from the seafloor travels: “Does it make it to the surface? Is it emitted to the atmosphere? Is it dissolving in the deeper waters?”
Continuous and autonomous measurements also allowed the team to do a preliminary analysis of the data while on the waters. “The nice thing about making measurements this way is we don’t have to wait until we get back to Rochester to learn something—we’re learning something literally as it comes off the screen,” Kessler observed. If the incoming numbers presented a unique feature or surprising occurrence, the ship could turn around to gather more information in that area, allowing for the most data collection.
Machine learning, a branch of AI that focuses on “teaching” processes how to leverage data to perform a task, is playing an enormous role in modeling the methane distribution data collected at sea. “Models like artificial neural networks are essentially pattern-recognition tools—it’s essentially the same technology as facial recognition software and the algorithms that predict your political leanings based on things you like on social media,” explained Weber. “For us, the pattern recognition tool is used to identify pattern similarities between variables that we have little data for (like methane) and other variables (‘predictors’) that we have lots of data for, like temperature and chlorophyll that we can measure from satellites.” After training the models using the information collected at sea, they can begin to predict methane concentration under any combination of variables, so long as data is being measured continuously. These predictions will derive continuous maps of surface methane, which will aid in emissions research and fill any knowledge gaps that currently exist. “Of course, our predictions will never be 100% correct and we have to be very careful about keeping track of uncertainties in our predictions,” Weber added.
Old questions, new tactics
Methane emissions research holds huge potential as scientists and policymakers scramble to better understand the ocean’s story. What are the fluxes—natural or anthropogenic—that exacerbate the warming climate? In what quantities does methane travel from coastal waters into the atmosphere? If the process is natural and values are stable, there is less concern to be had. However, if direct or indirect human influence over time is significant, what industries or activities are the contributors? Referencing the Deepwater Horizon oil spill and recent Nord Stream gas leaks, Kessler pointed out that past environmental crises have long indicated the need to better understand the dynamics of methane emissions.
This urgency and current lack of data are well answered by the implementation of machine learning models, although their application in the earth sciences is not new, shared Weber. Within oceanography alone, AI is helping to “estimate air-to-sea carbon dioxide and nitrous oxide exchange, quantify organic carbon fluxes in the biological pump, and map poorly sampled trace element distributions.” What makes this project special, both researchers agreed, is that it’s one of the first known direct collaborations between large field data measurement and machine learning model development. Not only is data collection efficiently sped up with autonomous and continuously working instruments, but he added, “It gives us the ability to ask exactly what type of data, and in what locations, we would need in order to improve the model predictions, and then go out and gather that data.”
Two fields, one goal
In a continuously changing climate and with global discussions fast approaching, including the 27th United Nations Framework Convention on Climate Change (better known as COP27), every moment of data collection is crucial to better understand the oceans and their fluxes. Methane, often discussed less than carbon dioxide, plays an indisputable role in the climate—yet there exists few maps and little information about their path from coastal oceans to the atmosphere. Current collaborations, including the University of Rochester one, should help close the gaps and yield better predicting methane emission patterns, which can in turn aid scientific analysis and policy design.
“This marriage of big data and AI with fundamental measurement science shows two fields that don’t normally work together. Having that connection has opened doors that we wouldn’t have been able to do and allowed us to explore things in real time,” Kessler concluded. It’s a partnership that could very well change the way scientists collect and analyze data, and it may be just the start.
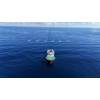
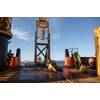
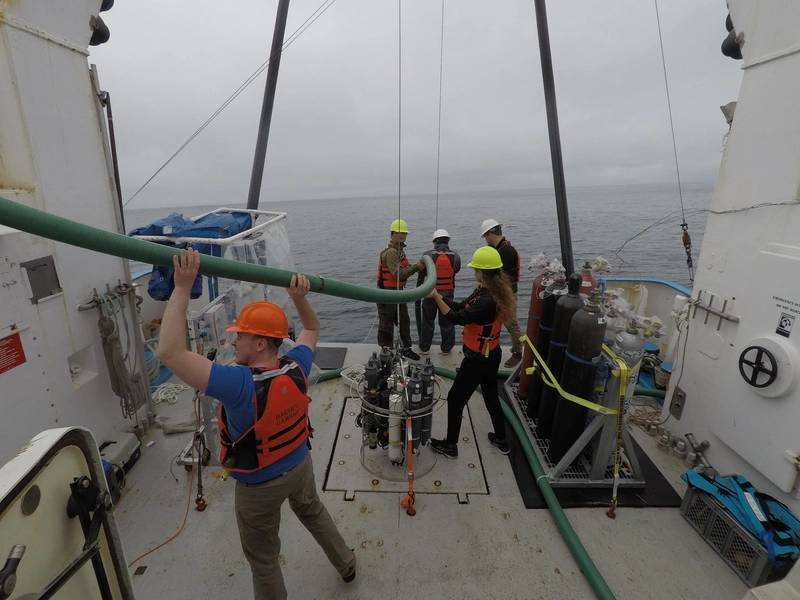 Dr. Thomas Weber (front left) and other scientists deploying hose to pump ocean water for analysis. All images: University of Rochester/John Kessler